If anything ever felt like a waste of time - it’d be sorting through the comments of ‘the cost of a pair of shoes’ post from the other day…what a barrel of fun!

For the most part, several people who understand how the internet works and understand the nature of information enjoyed the post...most tried to participate in a conversation about things that most of us can only speculate about. And that’s like one of the main points of the account; A collective conversation about the things we are interested in and would like to better understand.
So, again, I was not the creator of the graphic of the ‘cost breakdown of a $100 pair of shoes’, but I do think it is one of the more interesting infographics I’ve seen. And based on the cost of my own products, I believe it to be accurate. And if you’ve read ‘Shoe Dog’ by Phil Knight (the founder of Nike), I’m sure you could see it having merit. And if you do even just 3 minutes of research on the @google machine, you’ll find more than just a few articles with roughly the exact same breakdown as the one from the infographic.
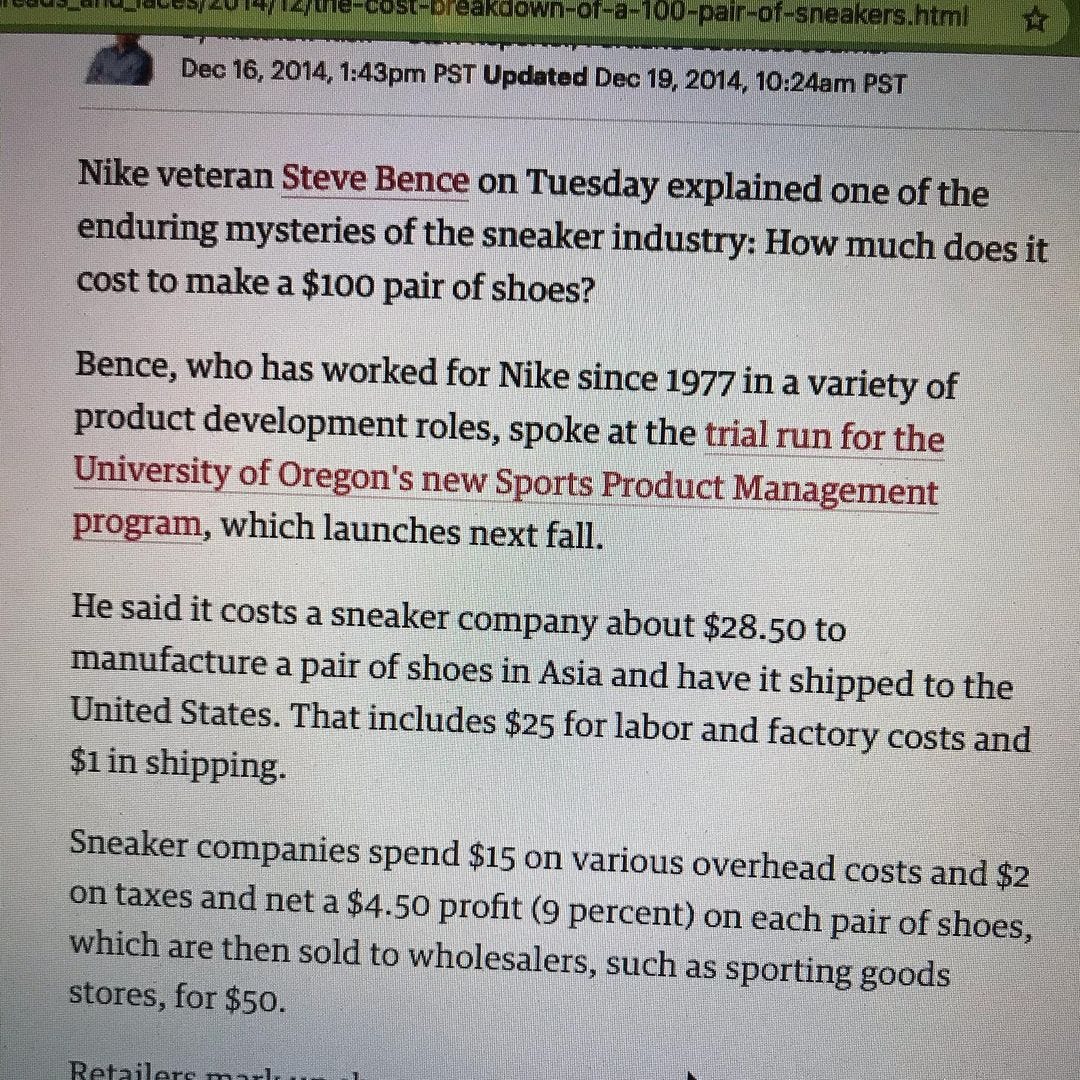
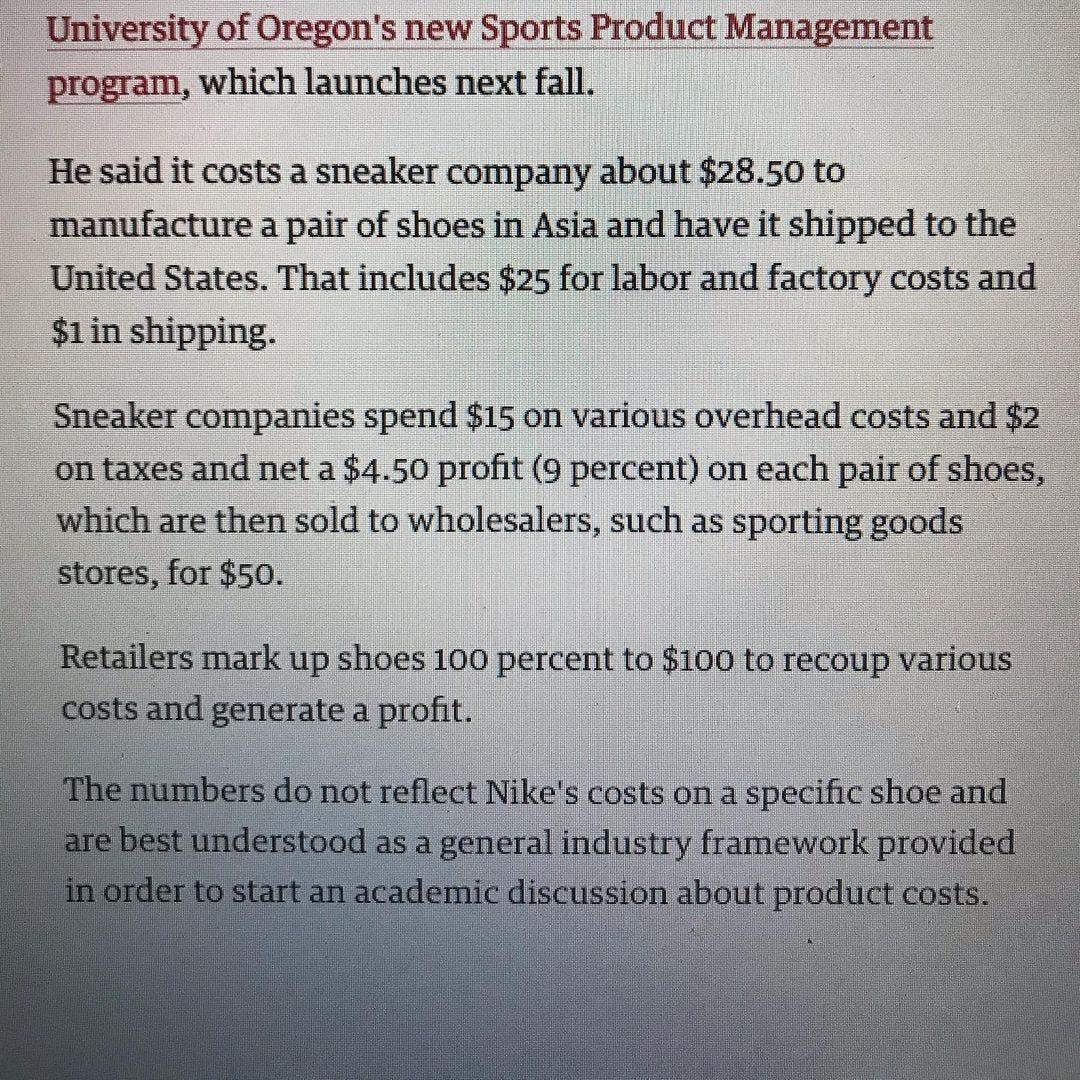
The breakdown in article above is from the Portland Business Journal in 2014 - and the author reports that Steve Bence - a Product Developer at Nike for nearly 40 years - broke down the cost in nearly the exact same way as the infographic. Sure - there are minor differences, but the basic point that I think we can look at - actual product cost is roughly 1/4 retail.
Again - Thoughts?